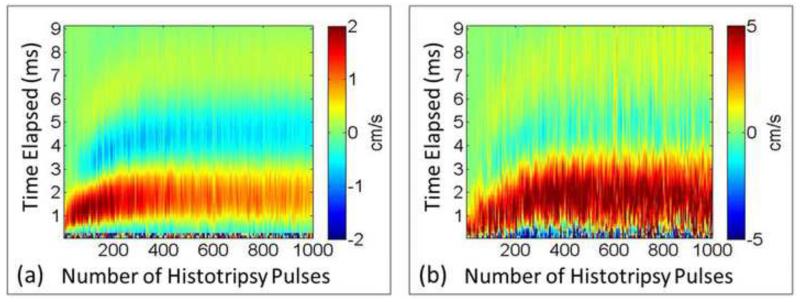
Figure 11.
Representative full profiles of mean axial velocity at the focal zone. (a) PIV estimation (only the proximal side). (b) BCD estimation. Positive values indicate motion towards the therapy transducer and negative values indicate motion away from the transducer. The horizontal axis shows the number of applied pulses and the vertical axis shows the delay from each histotripsy pulse.

