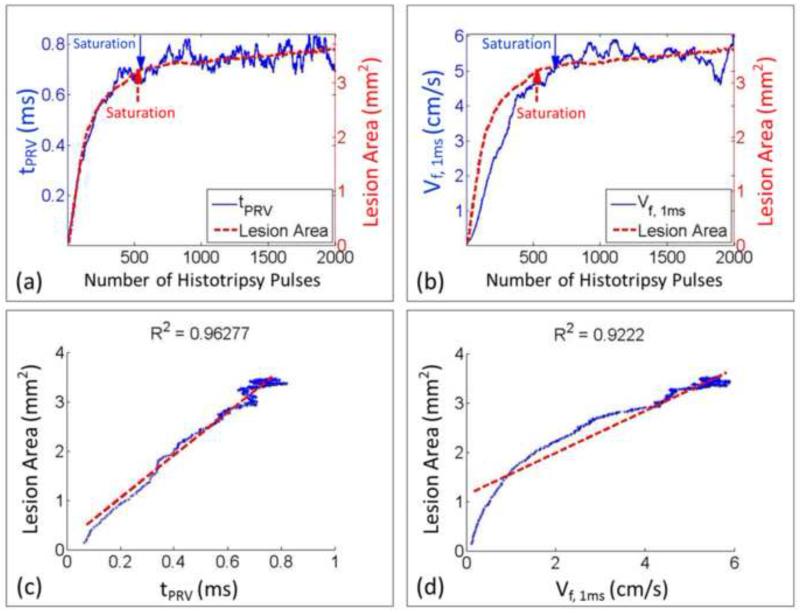
Figure 14.
Comparison between BCD feedback and histotripsy thrombolysis from a representative treated spot in a hard fibrin clot. (a) The progression curve of lesion area is compared with the time of peak rebound time (tPRV) from its BCD feedback. (b) The progression curve of lesion area is compared with the mean velocity of the focal zone at 1ms delay (Vf,1ms) from its BCD feedback. (c) The Pearson linear correlation between the progressions of lesion area and tPRV. (d) The Pearson linear correlation between the progressions of lesion area and Vf,1ms. The detected saturation doses were also illustrated.

