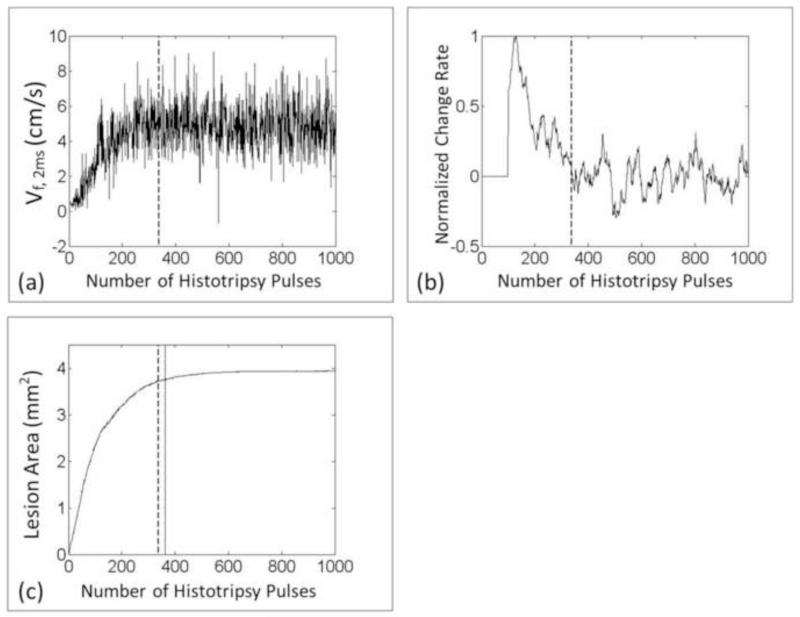
Figure 18.
(a) Real-time Vf,2ms of BCD feedback from one treated spot. (b) The real-time calculated change rate of Vf,2ms. (c) The corresponding progression of the lesion area. The vertical dashed line indicates the saturation dose real-time detected by the BCD feedback and the vertical solid line indicates the true saturation dose of the lesion progression, which represents the treatment completion.

