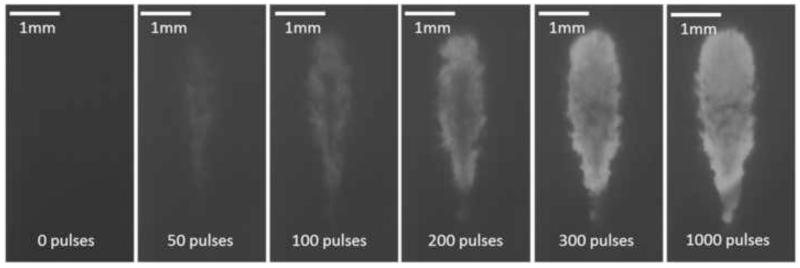
Figure 5.
Representative lesion formation of a treated spot in a soft three-layer fibrin clot. The lesions at different stages (pulse 0, 50, 100, 200, 300 and 1000) are shown here. These images were taken in the axial-lateral plane of the transducer, and the histotripsy pulses propagated from the top to the bottom of the field.

