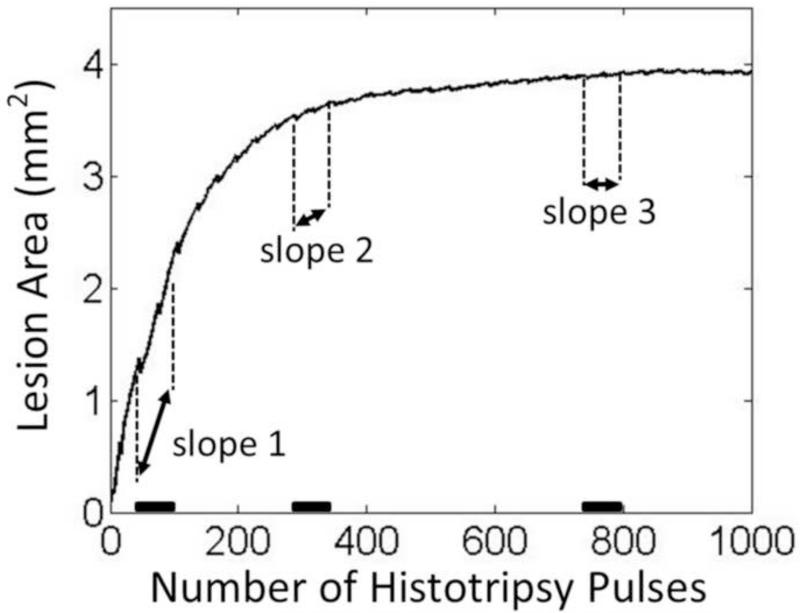
Figure 6.
The illustration of the slope detection algorithm. The lesion progression data shown here is from one treated sample. The slopes over three representative time windows are indicated. The highest change rate appears at the beginning of the treatment around the first time window (slope 1) and the saturation starts to occur around the second time window (slope 2).

