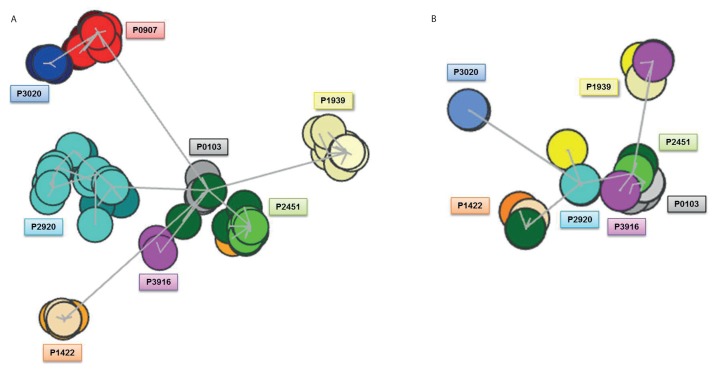
Figure 2.
Cluster formation when considering amino acids within the same physicochemical groups as equals. Figure 2A illustrates clustering of the IG heavy chains (n = 511) while figure 2B concerns clustering of the IG kappa light chains (n = 397). When considering amino acids within the same physicochemical groups (as defined by IMGT) as equals, a new cluster was formed at the heavy chain level between P3020 and P0907 (previously represented by two distinct clusters) while the effect on IG kappa light chains was minor and predominantly related to the separation of P2920 and P0907 from the central cluster. Circles are color coded to match the patient tag and different shades of the same color indicate subclonal sequences from the same patient but from a different time point. The number of circles appearing for each case is related to the level of ID observed.

