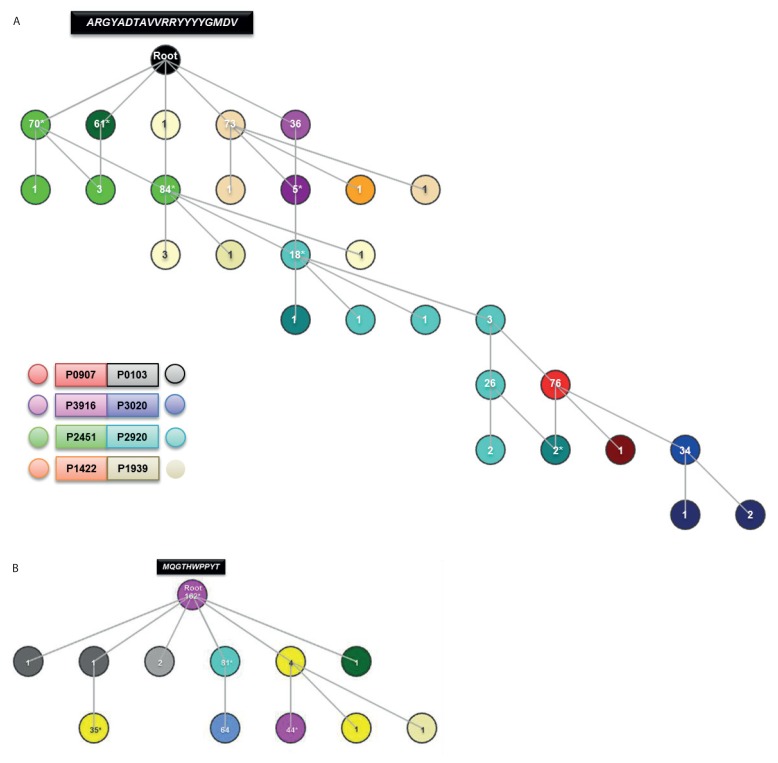
Figure 4.
Molecular phylogeny of the VH and VK CDR3 sequences of subset #4. Figure 4A illustrates how hierarchical visualization of the VH CDR3 amino acid sequence from all patients facilitated the construction of a VH CDR3 sequence that can now be considered as the root from which all subset #4 VH CDR3 sequences are derived. Since no patient’s VH CDR3 sequence exactly matched the derived root, they are visually placed as branches. Sequences that have an equal number of amino acid changes from the root are placed at the same level (within the same row), since they branch from the root in a similar manner. Figure 4B illustrates the above phenomena for the VK CDR3 amino acid sequences. The limited branching evidenced is indicative of sequence relatedness, with only one or two differences between any patient sequence and the derived root. Identical sequences overlap and are thus represented by a single circle. The asterisk indicates that this circle represents sequences from more than one case. The number within each circle indicates how many sequences carried that specific rearrangement.

