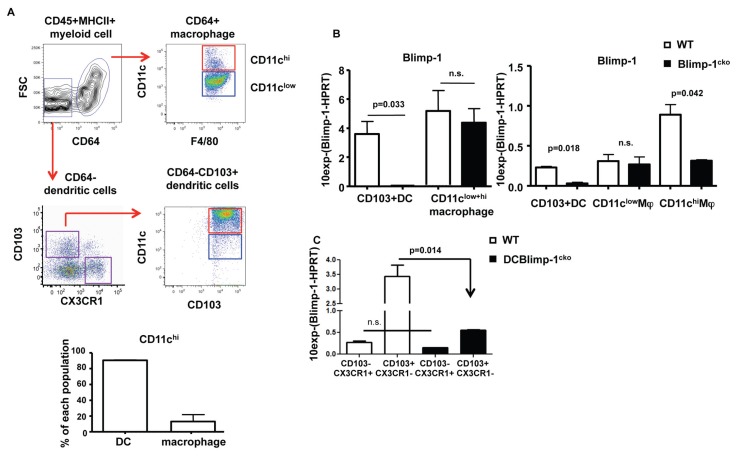
Figure 2.
Blimp-1 expression in DCs and macrophages. (A) Flow cytometry strategy of identifying colonic DC and macrophages. Graph represents percentage of CD11chi cells in DCs and macrophages. Mean ± standard error of the mean (SE) are shown (n = 5). (B) DCs and total CD64+F4/80+ macrophages (including CD11cint and CD11chi) (left graph) and CD11clow or CD11chi macrophages (right) were sorted as depicted in (A), and the level of Blimp-1 was quantified by qPCR. Mean ± SE are shown (n = 3). (C) Blimp-1 expression was measured by qPCR in CD103+ and CD103− colonic DCs from WT and Blimp-1cko mice. The graph presents the mean ± SE of three independent experiments.

