
Figure 4.
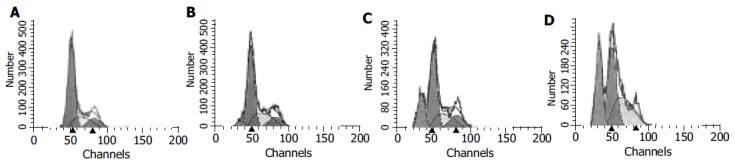
FACS analysis of cells treated with DMSO (A), 20 mmol/L apigenin (B), 40 mmol/L apigenin (C), and 80 mmol/L apigenin (D).
Official websites use .gov
A
.gov website belongs to an official
government organization in the United States.
Secure .gov websites use HTTPS
A lock (
) or https:// means you've safely
connected to the .gov website. Share sensitive
information only on official, secure websites.
FACS analysis of cells treated with DMSO (A), 20 mmol/L apigenin (B), 40 mmol/L apigenin (C), and 80 mmol/L apigenin (D).