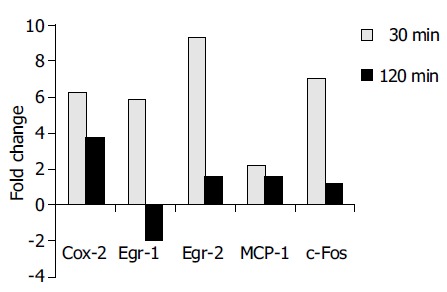
Figure 2.

Real-time RT-PCR analysis confirmed the differential expression of COX-2, Egr-1, Egr-2, MCP-1, and c-Fos in accordance to Affymetrix® array data. The results are indicated as positive ( = upregulation) or negative ( = downregulation) fold changes of mRNA amount compared to the control (t = 0 min, values normalized to 18S rRNA).
