
Figure 2.
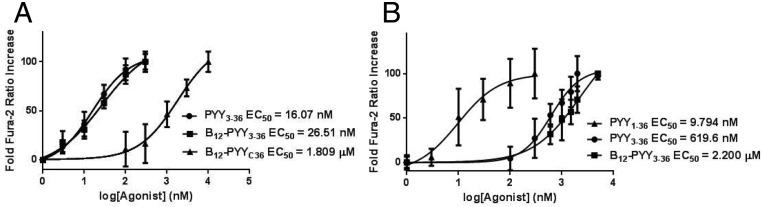
A, Dose-response curves of PYY3–36, B12-PYY3–36, and B12-PYYC36 null control with respective EC50 values as determined by fura-2 activity at the NPY2 receptor. B, Dose-response curves of PYY1–36 (run as an internal control), PYY3–36, and B12-PYY3–36 with respective EC50 values were determined by fura-2 activity at the NPY1 receptor.