Figure 8.
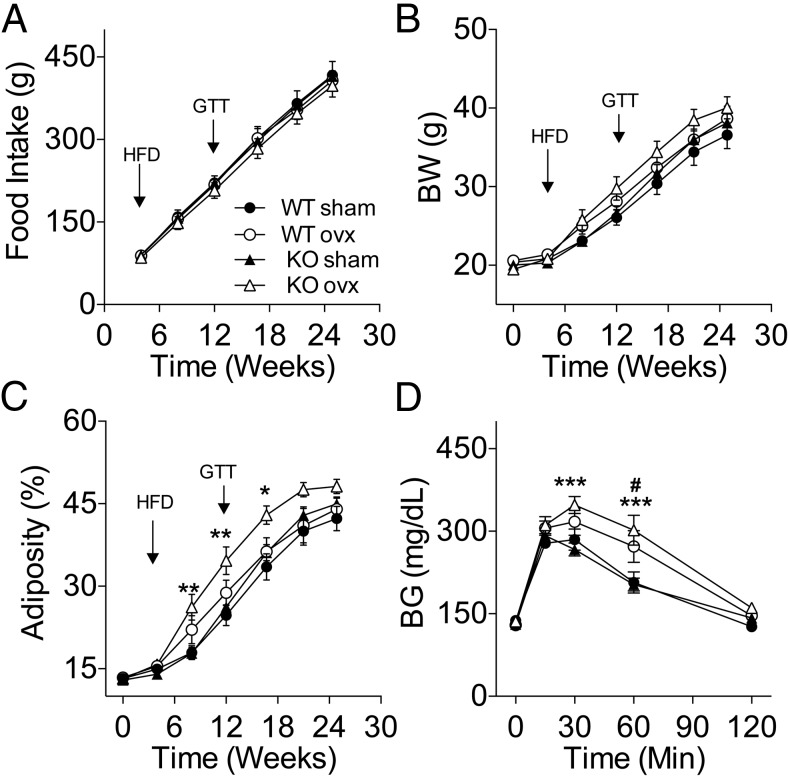
Increased susceptibility to diet induced obesity and glucose intolerance in high fat-fed OVX KO mice. Lean chow-fed mice were OVX or received sham surgery and were switched to a HFD 4 weeks later. A, Cumulative food intake. Neither surgery nor genotype significantly affected food intake before (data not shown) or after the switch to a HFD. B, Body weight. Although the presurgical BW of the KO was slightly lower than the WT controls (19.77 ± 0.2268g vs 20.47 ± 0.2409g; P < .05, t test), the percentage of adiposity was similar between WT and KO (13.32 ± 0.2651% vs 13.05 ± 0.2825%; respectively. A repeated measurement ANOVA detected a statistically significant difference in BW between KO-sham and KO-OVX (P < .05) during the duration of the study. C, Adiposity. A repeated measurements ANOVA detected a statistically significant difference in adiposity between KO-sham and KO-OVX (P < .01, main effect of the surgery; P < .001 main interaction effect between groups and time). Adiposity was calculated as ratio fat mass divided by the sum of fat mass and lean mass as determined using NMR. D, Glucose tolerance. KO-OVX BG levels were significantly higher than KO-sham at times 30 and 60 minutes after an ip glucose bolus (2 g/kg) (P < .001) in WT mice after 8 weeks of high-fat feeding. In contrast, KO-OVX mice were significantly glucose intolerant when compared with KO sham controls (P < .01, main effect of surgery) (D). Inset graph displays the area under the curve (AUC). #, P < .05: WT-sham vs WT-OVX; *, P < .05; **, P < .01; ***, P < .001: KO-sham vs KO-OVX, two-way ANOVA, Bonferroni post hoc test. Data presented as mean ± SEM, n = 10–13 mice per group.

