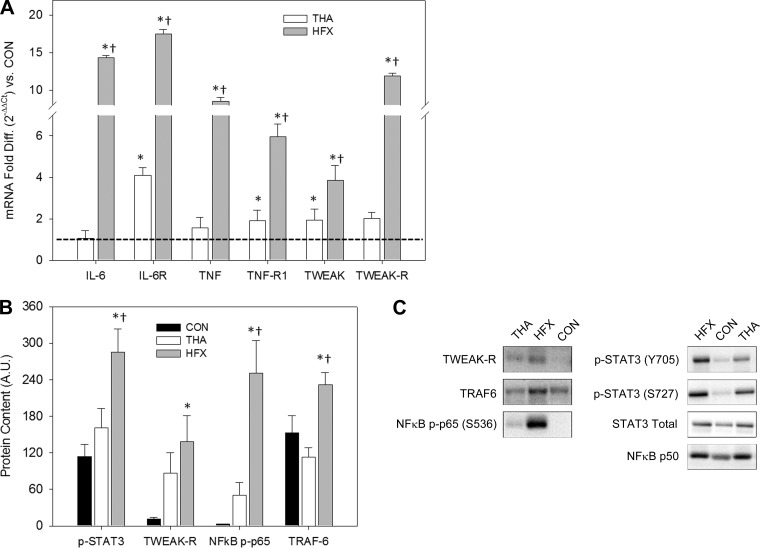
Fig. 2.
Inflammatory profile of muscle surrounding surgical hip. A: muscle gene expression in patients undergoing elective THA vs. HFX victims of 3 proinflammatory cytokines [IL-6, TNF-α, and TNF-like weak inducer of apoptosis receptor (TWEAK-R)] and their receptors relative to the CON group (dotted line). Values are means ± SD. *Different from CON, P < 0.05. †Different from THA, P < 0.05. B: muscle protein signaling results. S727 phosphorylation of STAT3 is plotted. A.U., arbitrary units. Values are means ± SE. *Different from CON, P < 0.05. †Different from THA, P < 0.05. C: representative immunoblots.

