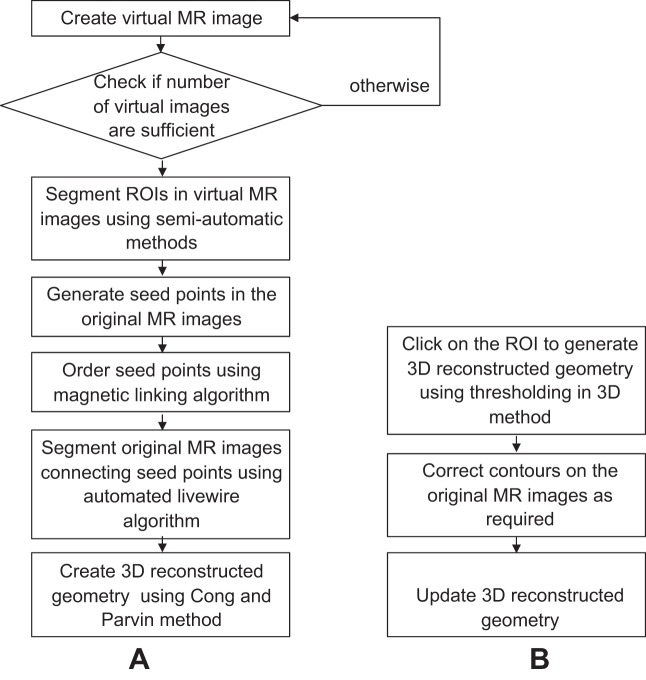
Fig. 4.
Flow chart of the 2 approaches used in this image analysis platform. In the first approach 3–4 virtual images were extracted from the 2D image stack, then these virtual images were segmented. By using the contours generated on the segmented virtual images, seed points were generated on the original images. The seed points were connected in specific order by magnetic linking and automated livewire algorithms to generate contour stacks ready for 3D reconstruction by the Cong and Parvin approach (9). In the second approach 3D reconstructed geometry is generated directly from the sets of 2D images with a single click and defined thresholds of image intensity, and then the resulting 3D geometry is manually corrected where needed and the 3D geometry is updated.

