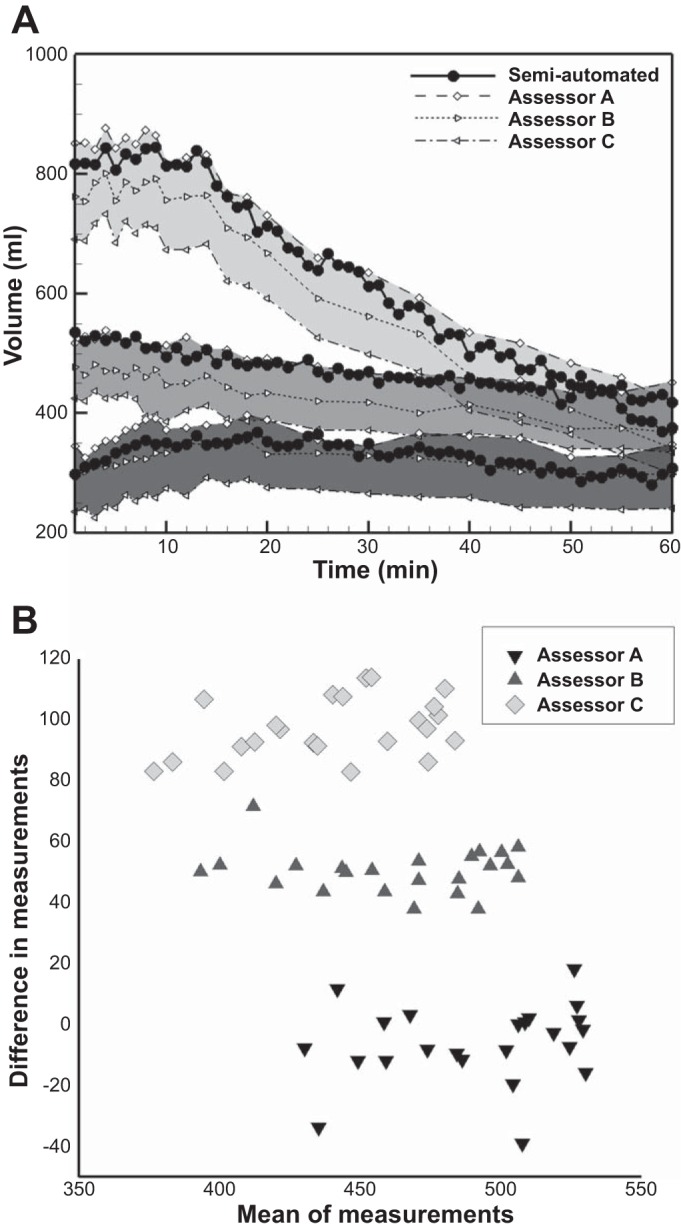
Fig. 7.

A: comparison of total gastric volumes by manual and semiautomated image analysis. Liquid meals of different volumes were infused into the stomach through a nasogastric catheter (dark gray shading, 200 ml; medium gray shading, 400 ml; pale gray shading, 800 ml). The characteristic rise and fall in gastric volume after meal infusion reflects the dynamic balance between meal volume, secretion volume, and gastric emptying over time. Black-filled circles indicate measurement of gastric volume in all 60 scans by the semiautomated system. Open symbols indicate measurement of gastric volume in 23 MR scans by the manual system. Note the systematic offset of volume measurements between each of 3 assessors A, B, and C (represented by different markers). B: Bland-Altman plot showing variations in gastric volume measurements between the assessors compared with that measured by the semiautomatic method for a normal subject (n = 23). The difference between the volume measurements by each assessor and the semiautomatic measurement has been plotted against the mean between them. The plot demonstrates the individual bias between the assessors.
