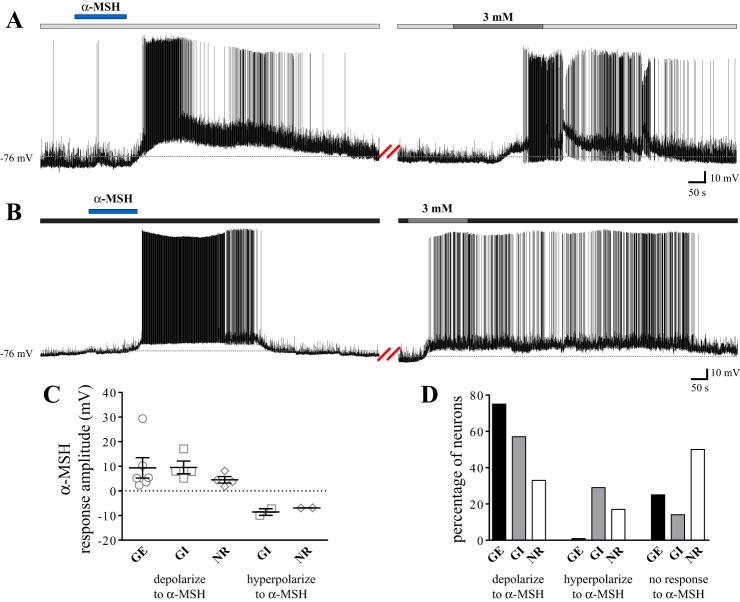
Fig. 4.
GE NTS neurons are more responsive to α-MSH than NR cells and are selectively depolarized by α-MSH. A and B: current-clamp recordings from two separate NTS neurons. A: α-MSH (500 nM; horizontal blue bar) elicited a reversible depolarization in this neuron subsequently identified as GE following an increase in glucose concentration from a baseline of 0.2 mM (horizontal pale gray bar) to 3 mM (horizontal medium gray bar). We note the amplitudes of these effects are above average for the population sampled. B: α-MSH elicited a reversible depolarization in this cell subsequently identified as GI following a decrease in glucose concentration from a baseline of 5 mM (horizontal dark gray bar) to 3 mM (horizontal medium gray bar). C: scatterplot depicting the range of responses elicited by 500 nM α-MSH in GE, GI, and NR NTS neurons. Mean α-MSH-induced depolarization: GE: 9.4 ± 4.2 mV, GI: 9.6 ± 2.6 mV, and NR: 4.5 ± 1.3 mV. Mean α-MSH-induced hyperpolarization: GI: −8.6 ± 1.3 mV, NR: −6.9 ± 0.02 mV. D: bar graph showing the percentage of GE (n = 8), GI (n = 7), and NR (n = 12) NTS neurons which also responded to α-MSH. More GE neurons exhibit depolarizing responses to α-MSH than NR NTS neurons (χ2; P = 0.04). There was no difference in the amplitude of α-MSH-induced effects across groups (ANOVA with Tukey's multiple-comparison test; P = 0.52 for depolarizations, unpaired t-test; P = 0.34 for hyperpolarizations).

