
Fig. 5.
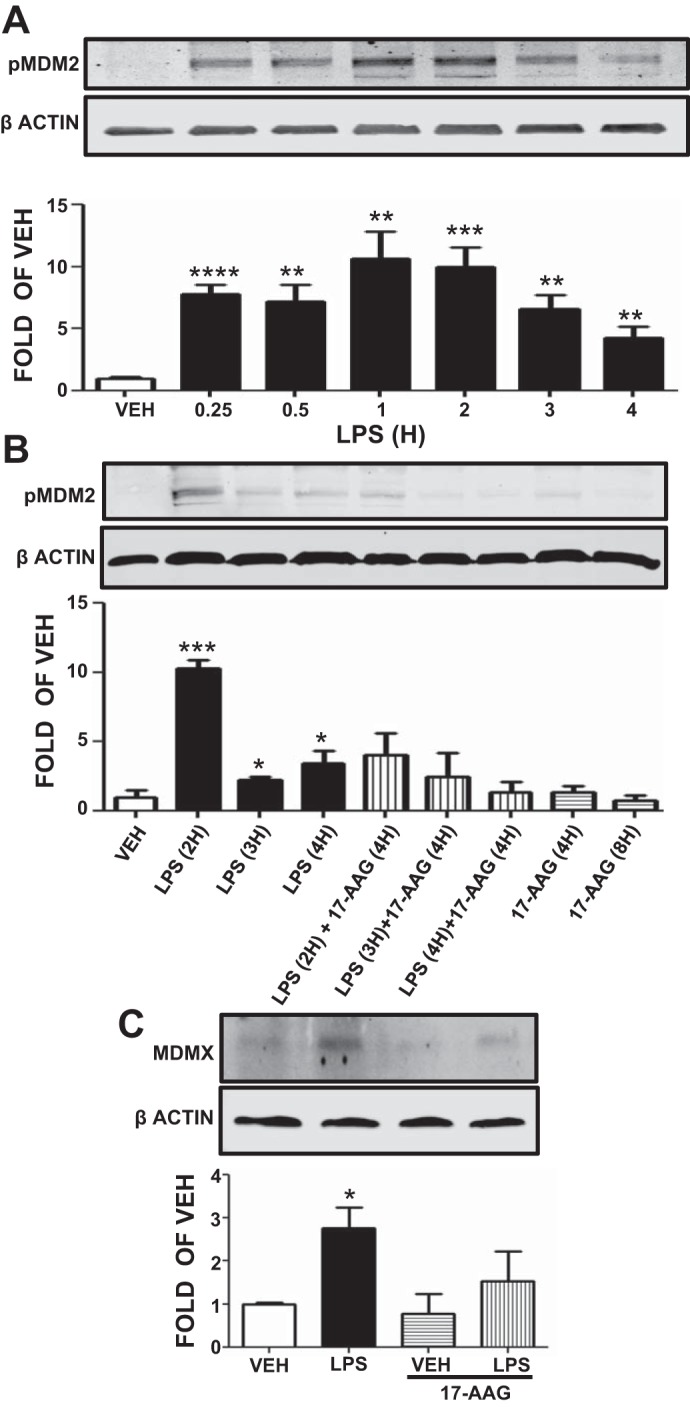
Effects of LPS and 17-AAG on MDM2 phosphorylation and MDMX expression. A: Western blot analysis of pMDM2 levels after treatment of HLMVEC with vehicle or LPS. Blot shown is representative of 4 independent experiments. Signal intensity of pMDM2 and β-actin was analyzed by densitometry. Protein levels were normalized to β-actin. **P < 0.01, ***P < 0.001, ****P < 0.0001 vs. vehicle. Means ± SE. B: Western blot analysis of pMDM2 levels in HLMVEC treated with LPS or vehicle and pretreated with 17-AAG or vehicle (10% DMSO). Blot shown is representative of 3 independent experiments. Signal intensity of pMDM2 was analyzed by densitometry. Protein levels were normalized to β-actin. *P < 0.05, ***P < 0.001 vs. vehicle. Means ± SE. C: Western blot analysis of MDMX levels in HLMVEC treated with LPS or vehicle and pretreated with 17-AAG or vehicle (10% DMSO). Blot shown is representative of 3 independent experiments. Signal intensity of MDMX was analyzed by densitometry. Protein levels were normalized to β-actin. *P < 0.05 vs. vehicle. Means ± SE.