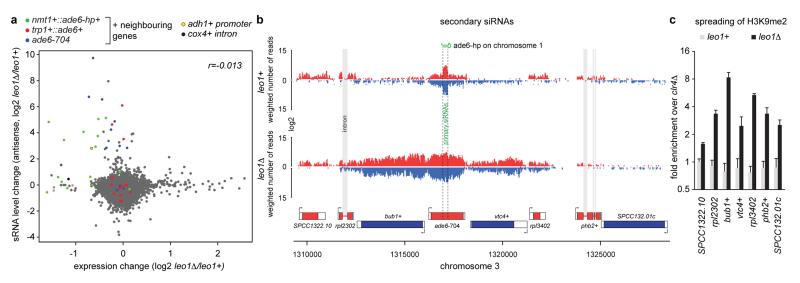
Extended Data Figure 10. Formation of ectopic heterochromatin.
a, Differential gene expression compared to differential antisense siRNA expression in leo1Δ. Gene expression profiles were obtained with whole-genome tiling arrays and small RNA profiles by deep sequencing. Genes neighboring the nmt1+::ade6-hp+, trp1+::ade6+, and ade6-704 loci are marked in color (see also Supplementary Table 1). b, siRNA reads mapping to the ade6-704 locus in leo1+ and leo1Δ strains. Red, plus strand; blue, minus strand. Intronic rpl2302 siRNAs in leo1Δ cells indicate co-transcriptional dsRNA synthesis by RDRC prior to splicing. c, ChIP experiment showing H3K9me2 enrichments on genes surrounding the ade6-704 locus in leo1+ and leo1Δ cells. Enrichments were calculated relative to background levels obtained in clr4Δ cells and normalized to adh1+. Error bars, SD; mean of n=2 independent biological replicates.

