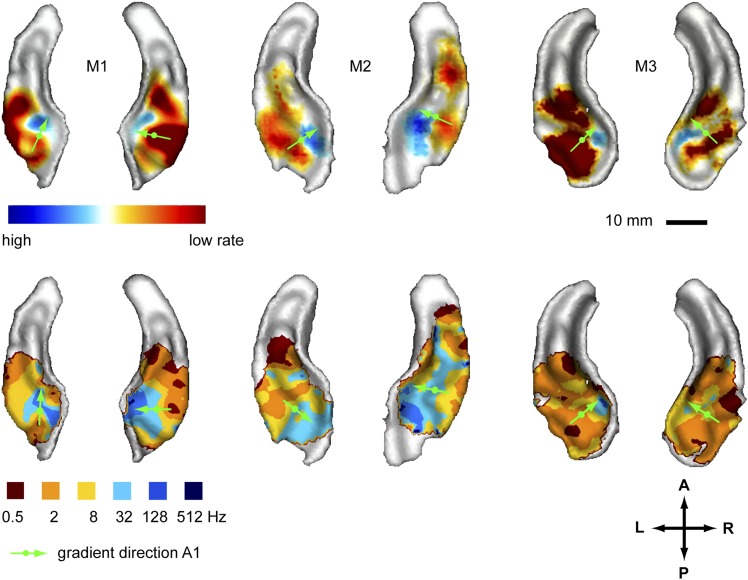
Figure 1. Representation of amplitude modulation rates in the auditory cortex.
Top panels: map showing contrast of low vs high rates (rate contrast map) projected on rendered surfaces of the superior temporal planes in three animals (M1-3). Green arrows indicate mean gradient direction of the contrast in auditory field A1 (gradient directions derived from 2D regression; see also Table 1). Green circles indicate the position of the centre of mass of A1. Bottom panels: map of preferred response to different rates (Best-rate map). A; anterior, P; posterior, L; left, R; right.

