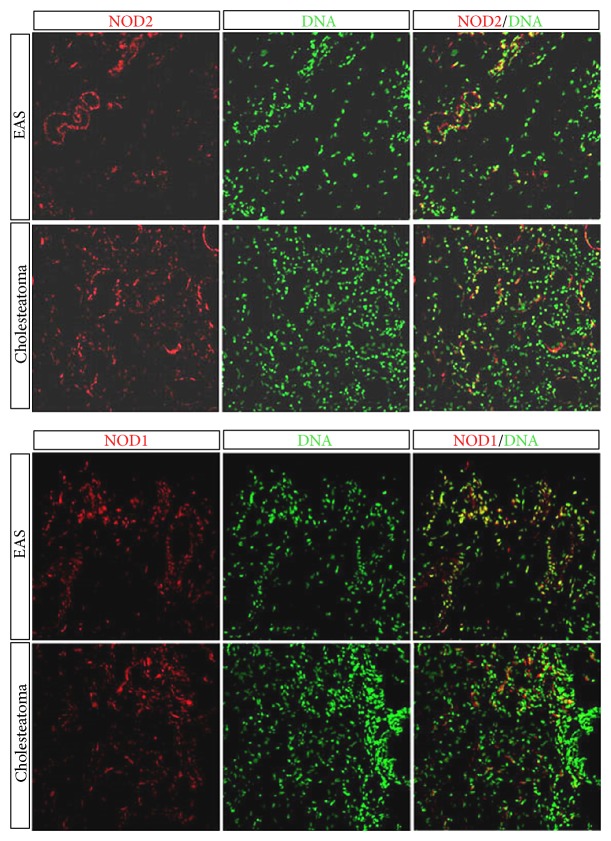
Figure 2.
Localization of NOD2 and NOD1 in cholesteatoma and in external auditory canal skin (EAS). Protein expression in cholesteatoma demonstrates a higher expression of NOD2 within the cholesteatoma compared to EAS, whereas NOD1 displays no significant change compared to EAS. Upper column displays a positive immunofluorescence staining of NOD2 and NOD1 in EAS compared to cholesteatoma in the lower column imaging staining, using a confocal microscope. Red represents the target genes NOD1 and NOD2 and green represents nuclei.

