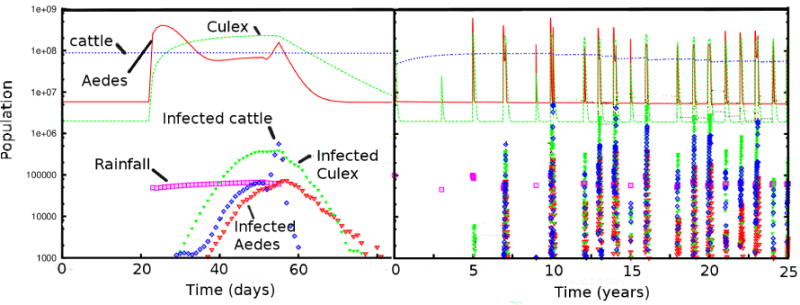
Figure 3.

Epidemic timelines for populations (top) and infected populations (bottom) of Aedes and Culex mosquito, and cattle versus time. On the left, one cycle of an epidemic is shown, while in the right are shown the sporadic epidemics over 25 years. Rainfall is modulated stochastically in a rough approximation to the patterns shown in Figure 2, and is shown in squares with an arbitrary scale.
