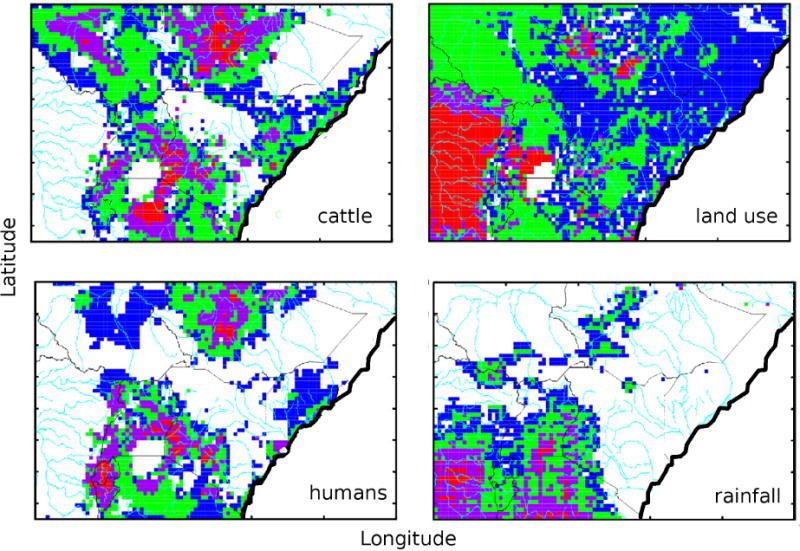
Figure 4.

Spatial distribution of hosts and risk factors, geographic data for cattle populations [17], land use [24], human populations [7], and rainfall for January 1–10, 2007 [48]. For cattle, red indicates densities > 1,000 per km2; for land use, red indicates broad-leaf trees, green indicates mixed forests and grasslands, and blue desert (details of classification are provided in [24]; for human populations, red indicates densities > 100 per km2; for rainfall in the first ten days of 2007, red indicates > 10 cm.
