
Figure 5.
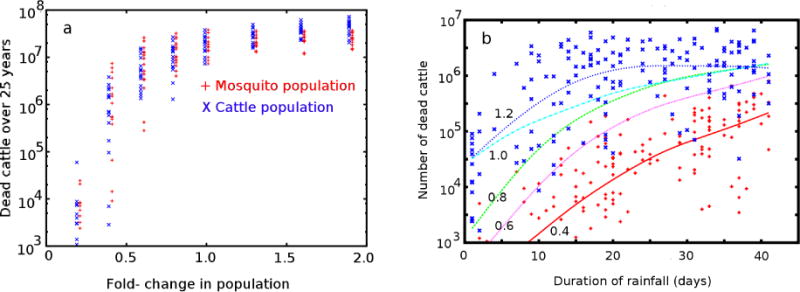
Important drivers of RVF epidemic severity. (a) Population density dependence of consequence over 25 years for cattle and mosquitoes. (b) Total deaths in a given year vs. the duration of the rainy seasons for the indicated mosquito densities of 0.4 (red +), 0.6 (magenta line), 0.8 (green line), 1.0 (cyan line), and 1.9 (blue x) times that of baseline case. The smoothing spline was a heavily smoothed cubic spline, as implemented with the Gnuplot function acspline and a weighting parameter of 0.001; in the limit of zero weighting, this function provides a simple linear least squares fit to the data. Since the individual years were sampled from a 25 year simulation, the curves sample over not only the range of rainfall durations, but also the variety of possible sequences of wet and dry years.