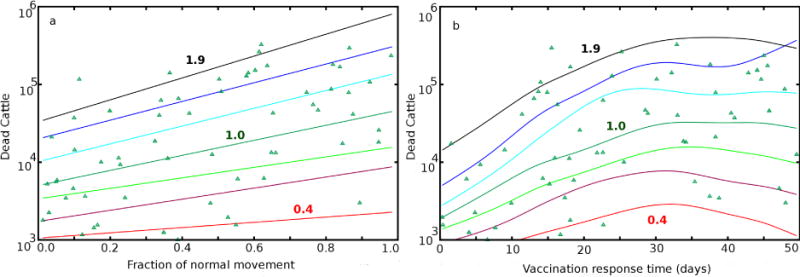
Figure 6.

Mitigation strategies. Smoothing splines indicating deaths per individual epidemic, aggregated over 25 year simulations, as a function of (a) fraction of normal movement, and (b) vaccine response times, for different mosquito densities, with values of 0.4, 0.6, 0.8, 1.0, 1.3, 1.6, and 1.9 indicating the fraction of the baseline mosquito population used, from bottom to top. For the basline case, (green, labeled 1.0), symbols are shown for each run determining the spline. Both plots were made from the same set of runs with both variables sampled over the indicated uniform distributions. The smoothing spline was a heavily smoothed cubic spline, as implemented with the Gnuplot function acspline and a weighting parameter of 0.001; in the limit of zero weighting, this function provides a simple linear least squares fit to the data. Most of the impact of vaccination occurs in subsequent years.
