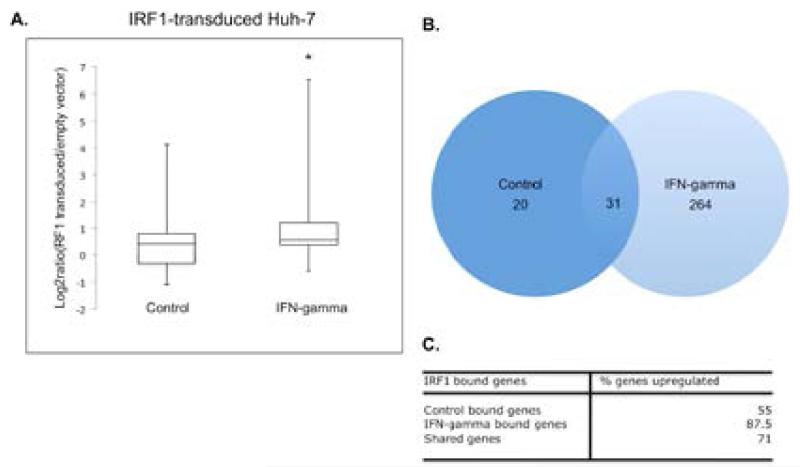
Figure 6.
Gene expression analysis shows IRF1 bound genes in IFN-gamma stimulated cells are generally up-regulated A. Shown is the distribution of expression values (log2 ratios) from IRF1-transduced Huh-7 cells (GEO, GSE26817). Boxplots depict median value for the ChIP-seq control IRF1 bound gene group and IFN-gamma IRF1 bound gene group. Statistical difference between the two groups was evaluated using the Student t-test, *p-value, 0.0173) B. Venn diagram of total mapped genes from each ChIP-seq condition (control or IFN-gamma) present on the list of valid transformed log2 ratios (p-value ≤ 0.05) C. Shown is a table depicting the percent up-regulation of ChIP-seq bound genes from each condition, including overlapping genes.

