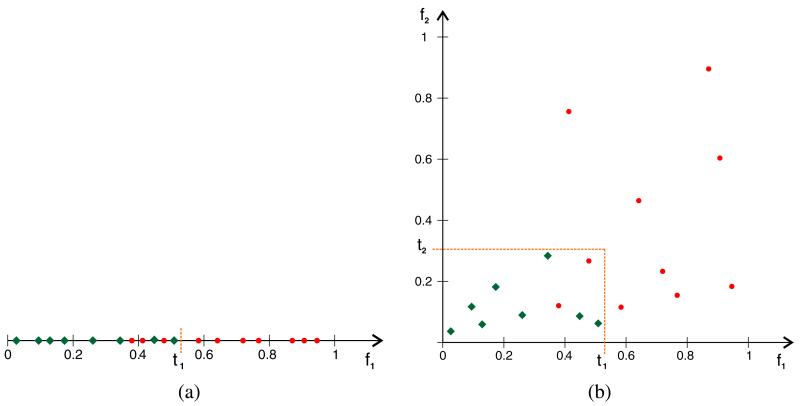
Figure 14. Threshold estimation and validation.
(a) The estimation of safe threshold value for a feature f1. True positives are represented as green diamonds, false positives are represented as red circles. The threshold t1 is increased (starting with 0) until all true positives are on one side (left) of the threshold. (b) The extension of (a) into two dimensions using an additional feature f2 with a corresponding threshold t2. Detections which are located in the rectangle bounded by both thresholds pass the validation (corresponding to a logical AND); all other detections are rejected.

