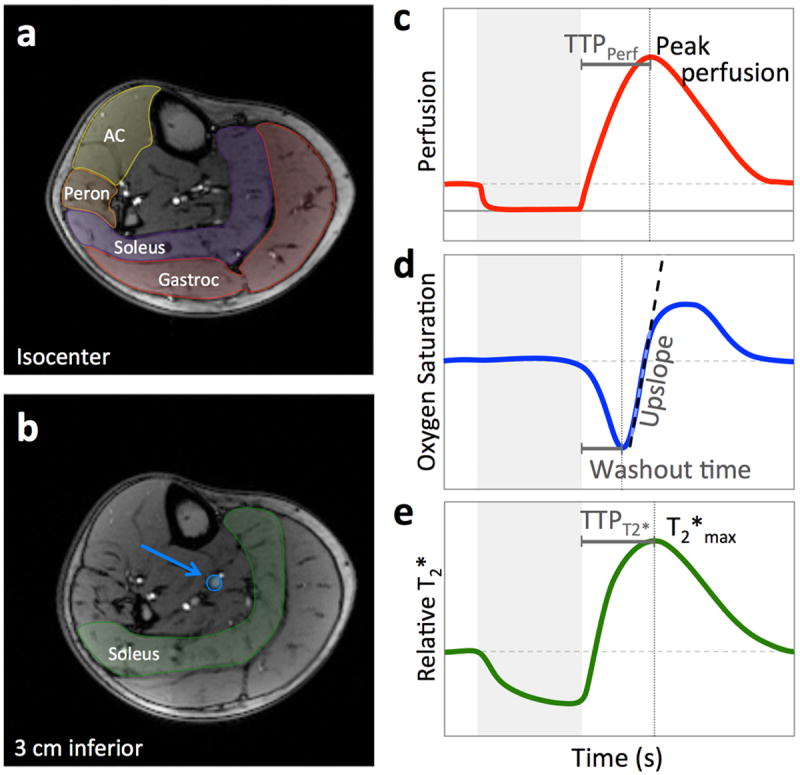
Figure 1.

Anatomic images corresponding to PASL (a) and multi-echo GRE (b) slice locations. As shown in (a), perfusion is quantified in regions of interest in the gastrocnemius (red), soleus (purple), peroneus (orange), and anterior compartment (AC) (yellow). From the multi-echo GRE data, SvO2 is quantified in the larger posterior tibial vein (blue arrow), and T2* is calculated from a region of interest in the soleus (green) shown in (b). Each variable is quantified every two seconds, yielding a dynamic time course. Schematics of the perfusion (c), SvO2 (d), and T2* (e) time courses are shown, with the extracted metrics indicated. The grey box in c-e indicates the period of proximal arterial occlusion.
