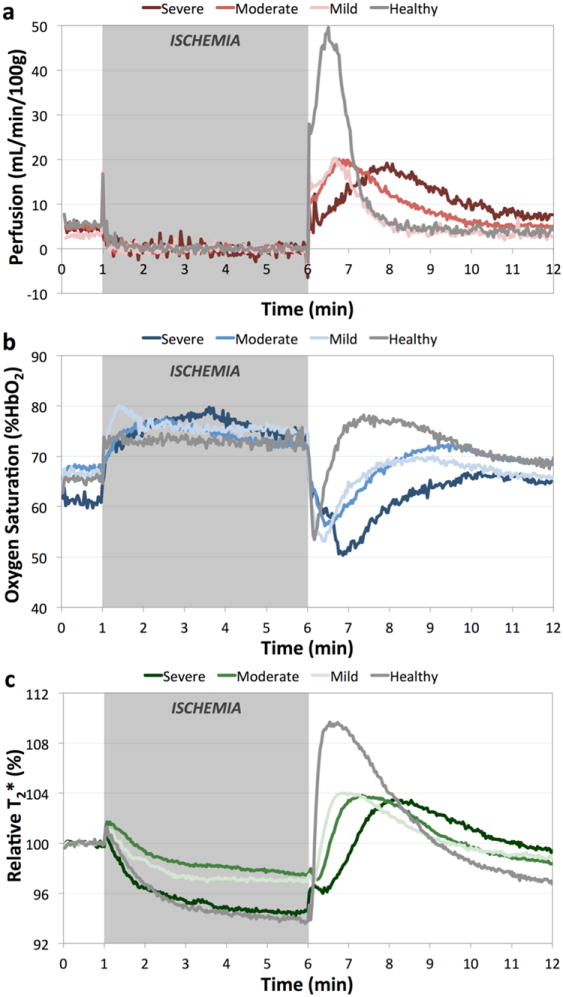
Figure 2.

Group-average time courses for healthy subjects (grey), and patients with mild (light colored), moderate (medium colored), and severe (dark colored) PAD for gastrocnemius muscle perfusion (a), posterior tibial vein SvO2 (b), and relative T2* in the soleus muscle (c). Grey box indicates the period of proximal arterial occlusion. With increasing disease severity, there is a delay in the reactive hyperemia response evident in each variable that was measured.
