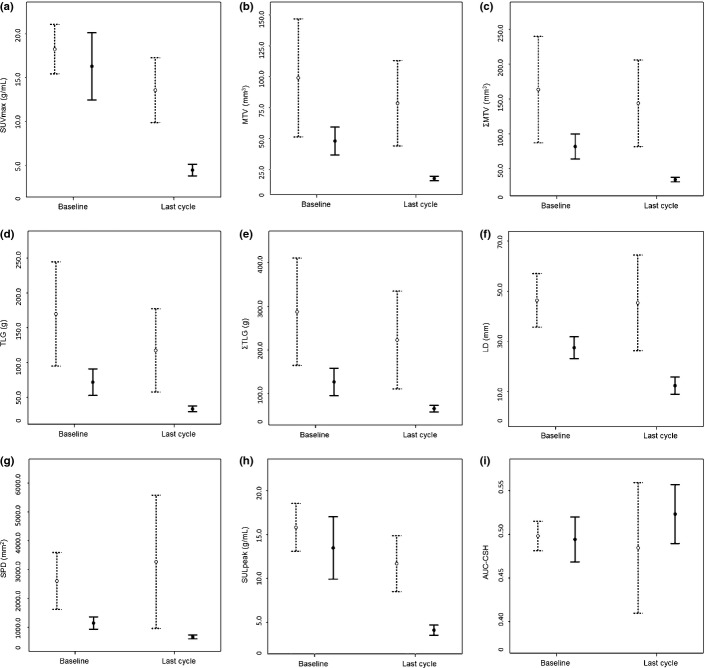
Fig 2.
Absolute values of PET/CT parameters in the complete response (CR, solid bar) and non-CR (dash bar) groups after the last cycle of treatment assessed according to the Lugano classification. Maximum standardized uptake value (SUVmax, g/mL) (a), metabolic tumor volume (MTV, mm3) (b), sum of MTV for a maximum of six target lesions per patient (ΣMTV, mm3) (c), total lesion glycolysis (TLG, g) (d), and sum of TLG for a maximum of six target lesions per patient (ΣTLG, g) (e) are shown. Large diameter (LD, mm) (f), sum of the products of the maximum perpendicular diameters (SPD, mm2) (g), peak value of SUV corrected for lean body mass (SULpeak, g/mL) (h), and the area under the curve of cumulative SUV–volume histogram (AUC-CSH) (i) are shown. The absolute values of all PET/CT parameters except for AUC-CSH did not overlap between baseline and after the last cycles in the CR group.

