FIG 5.
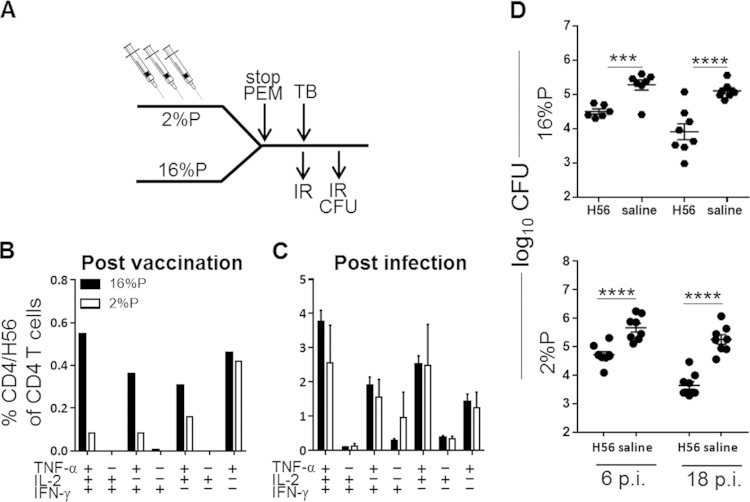
Impairment of vaccine-induced immune response by PEM is reversed by reconstitution of the diet during infection. (A) Experimental outline. Groups of mice were fed a 2%P or 16%P diet during the vaccination period (three vaccinations given at 3-week intervals). Two weeks after the final vaccination, all mice were fed the standard 16%P diet for the rest of the experiment. (B) Groups of mice were bled postvaccination, and PBMCs were stimulated with H56 for 6 h before staining for CD4, TNF-α, IFN-γ, and IL-2 for ICS analysis. Bar graphs denote frequencies of the CD4/H56 subsets for 16%P (black bars) and 2%P (white bars). Data are displayed as the mean ± the standard error of the mean of a pool of four mice per group. (C) Groups of mice were sacrificed at week 18 p.i., and lymphocytes were obtained from perfused lungs, stimulated with H56, and stained for ICS as described above for 2%P (white bars) and 16%P (black bars, also shown in Fig. 4C). Data are depicted as the mean ± the standard error of the mean of three or four individual animals. All background values from medium-stimulated cells (<0.5%) have been subtracted. (D) Lungs were harvested at weeks 6 and 18 p.i. from mice fed 2%P and 16%P (the 16%P data are also shown in Fig. 4B) during vaccination. Bacterial numbers were assessed by culturing lung homogenates at 37°C, and results are expressed as log10 CFU counts. Data are expressed as the mean ± the standard error of the mean (n = 8 to 16 mice). Statistical analysis was done by two-way ANOVA with a Bonferroni posttest for multiple comparisons. ***, P < 0.001; ****, P < 0.0001.

