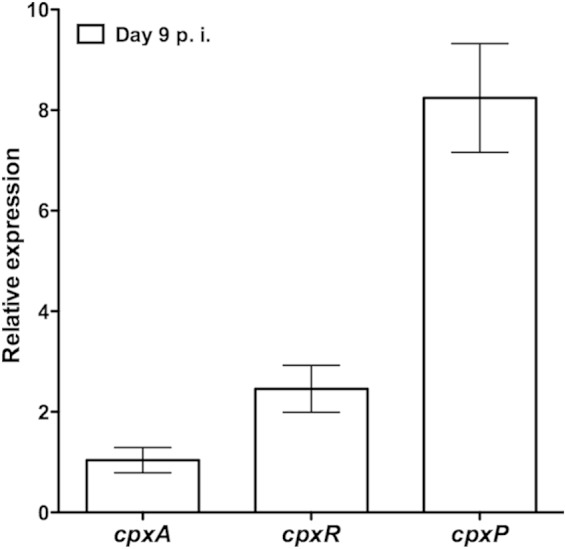
FIG 1.

qPCR analysis of cpx gene expression during infection of C57BL/6J mice. Data were normalized to rpoD expression levels. Relative expression is indicative of 2−ΔCT. Data shown are the means ± standard errors of the means from 5 biological samples, in triplicate. p.i., postinfection.
