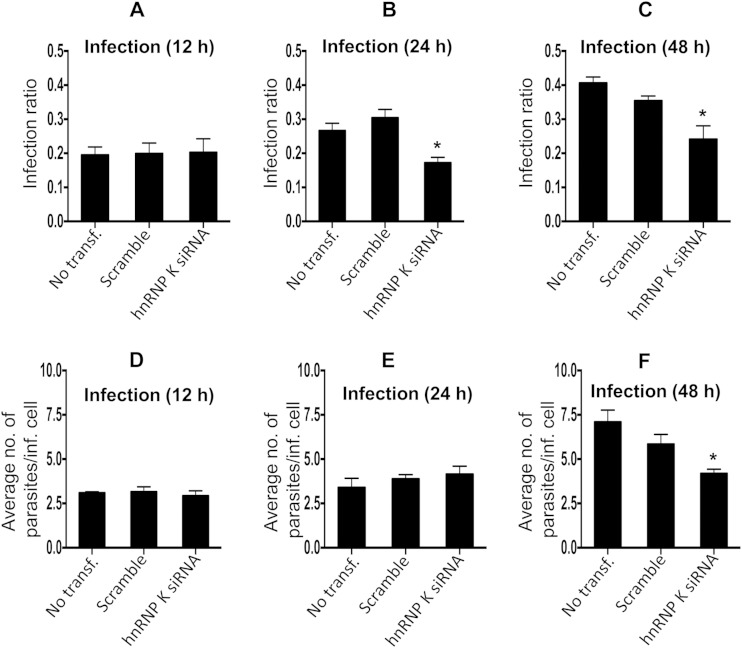
FIG 6.
(A to C) Bar diagrams showing the effect of gene knockdown of hnRNP K on the variation of the infection ratio at 12 h (A), 24 h (B), and 48 h (C). (D to F) Average number of parasites/infected cell at 12 h (D), 24 h (E), and 48 h (F). Results are representative of data from three separate experiments. Student's two-tailed t test was applied to analyze the data. *, P < 0.05. inf., infected; transf, transfection.

