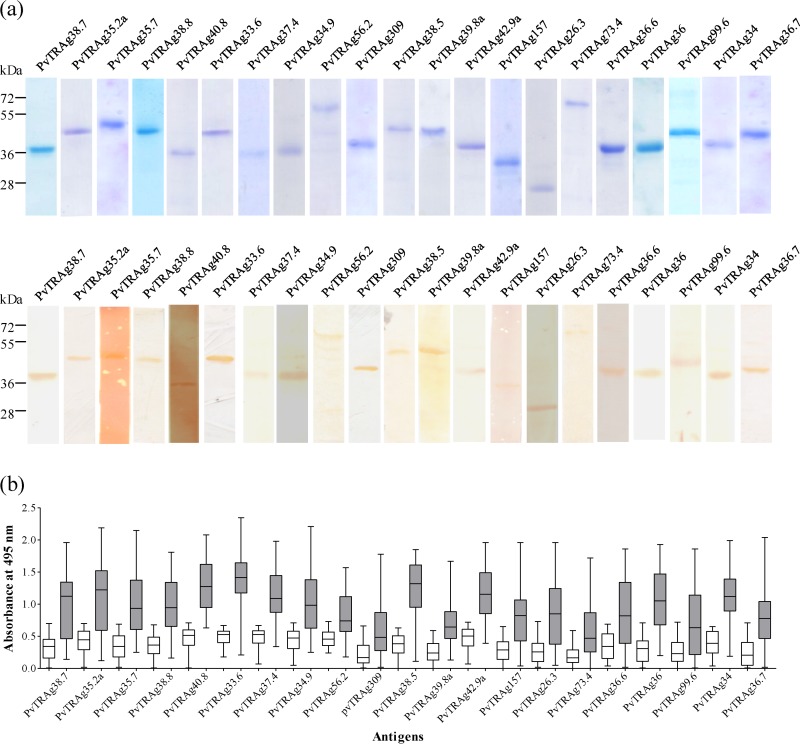
FIG 2.
Naturally acquired antibodies against different PvTRAgs. (a) SDS-PAGE and Western blot analysis. Each of the purified histidine-tagged PvTRAg (5 μg/well) was separated by using SDS–12% PAGE (upper panel). Protein bands were transferred to nitrocellulose membrane, and blots were developed with 1:200 dilutions of pooled sera from five P. vivax patients. Molecular mass markers are indicated on the left in kilodaltons. (b) ELISA results. ELISA was performed using serum samples at a 1:200 dilution from P. vivax-exposed (n = 54) and malaria-naive individuals (n = 40) against different PvTRAgs. The box represents the interquartile range or the middle 50% of observations. The horizontal line represents the median. Whiskers represent the minimum and maximum observations.

