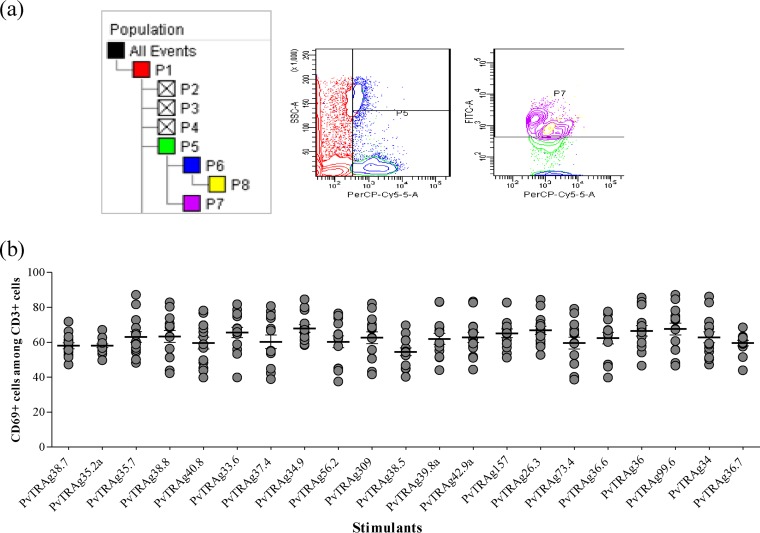
FIG 4.
Expression level of CD69 among CD3+ cells. (a) Representative contour plots showing the frequency of CD69 expression among CD3+ cells. The percentage of cells expressing CD69 (P7) was analyzed by flow cytometry on gated CD3+ T cells (P5). (b) Expression pattern of activation antigen (CD69) among CD3+ cells of P. vivax-exposed individuals in response to different PvTRAgs. Each bar indicates the mean percentage ± the standard error of the mean.

