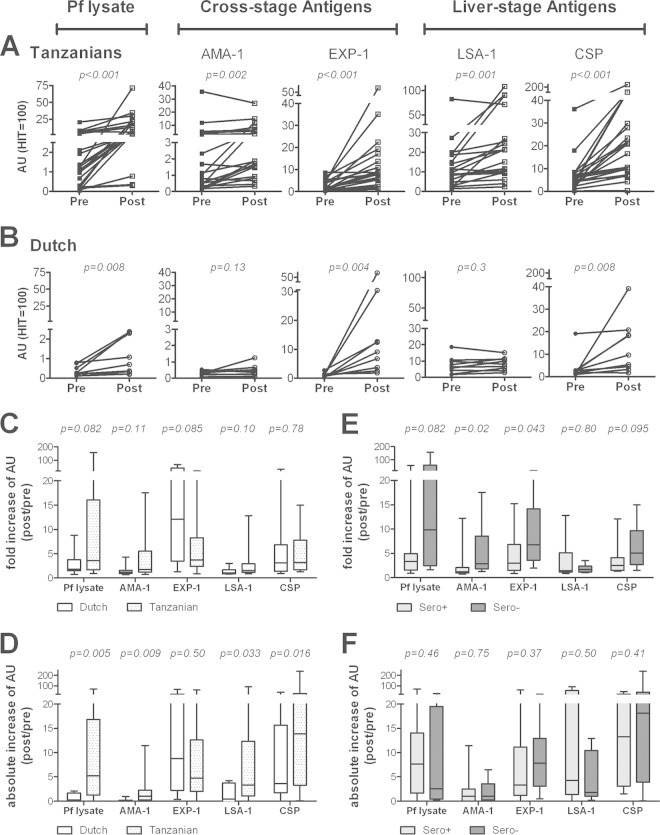
FIG 3.
Increased humoral responses in Dutch and Tanzanians after CHMI. Antibody titers were measured 4 weeks (Tanzanians; squares; n = 21) (A) and 5 weeks (Dutch; circles; n = 9) (B) after intradermal infection with PfSPZs. Graphs show the antibody reactivity (AUs) pre-CHMI (black) and post-CHMI (white) against crude P. falciparum lysate, AMA-1, EXP-1, LSA-1, and CSP. Plots show individual data points, with lines connecting the two time points for each volunteer. Responses in the two cohorts pre- and post-CHMI were compared by using a Wilcoxon matched-pairs signed-rank test. The fold increase (ratio of AU post-CHMI/AU pre-CHMI) (C, E) and absolute increase in antibody reactivity (AU post-CHMI minus AU pre-CHMI) (D, F) were calculated for Dutch versus Tanzanian volunteers (C, D) and in Tanzanian volunteers classified as P. falciparum lysate seropositive or seronegative at baseline (E, F). Data are shown as whisker plots, with boxes indicating the median and IQR, and whiskers indicating the minimum/maximum values. Responses were compared using a Mann-Whitney U test.

