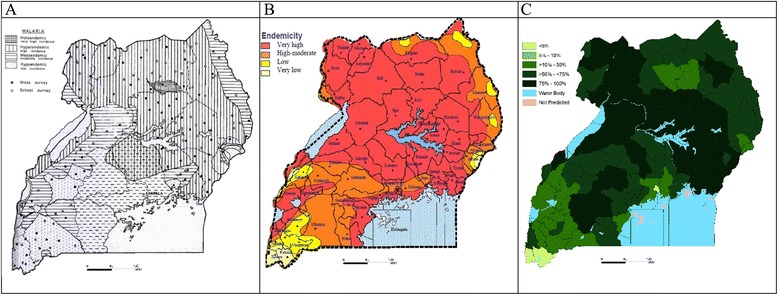
Figure 1.

Malaria risk maps developed in A) 1960s, B) 1990s and C) 2013. A) Malaria endemicity regions obtained from surveys between 1965–1967 [24]. B) Malaria risk map used in national malaria strategies and other MoH documents from 2005. Redrawn in colour from data from1967 [24], complimented by data collected in the early 2000 [44,45]. C) Population adjusted mean PfPR2–10 (PAPfPR2–10) in 2010 [77]. To compute PAPfPR2–10 a Bayesian hierarchical space-time model was implemented through Stochastic Partial Differential Equations using Integrated Nested Laplace Approximations for inference [13]. The covariates were used together with the parasite rate data to predict malaria risk were temperature suitability index, precipitation, enhanced vegetation index and urbanization. Continuous maps of PfPR2–10 maps were then predicted at 1 × 1 km. The continuous maps of PfPR2–10 and matching population density grids projected for 2010 were then used to compute the number persons likely to be positive and the populations at risk by district at each 1 × 1 km PfPR2–10 grid location. These were then used to compute PAPfPR2–10.
