
Figure 4.
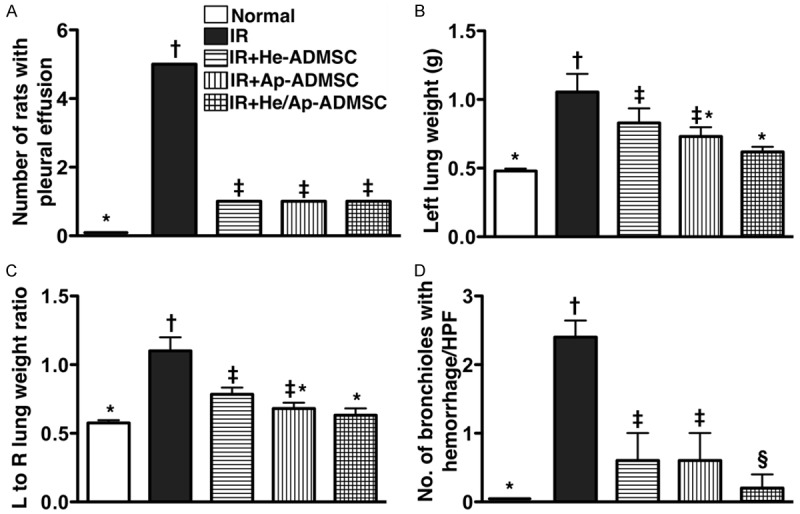
Gross pulmonary pathological changes at 72 h after ischemia-reperfusion (IR). A. The number of rats with bloody pleural effusion in each group. *vs. other bars with different symbols, p < 0.0001. *vs. other bars with different symbols, p < 0.001. B. Comparison of left lung weight among the five animal groups at post-IR 72 h. *vs. other bars with different symbols, p < 0.001. C. The ratio of left (L) to right (R) lung weight. *vs. other bars with different symbols, p < 0.0001. D. Comparison of the number of bronchioles with hemorrhage per high-power field (HPF) (100x) among the five groups (P.S. Please refer to hematoxylin eosin-stained sections in Figure 4). *vs. other bars with different symbols, p < 0.0001. All statistical analyses using one-way ANOVA, followed by Bonferroni multiple comparison post hoc test. Symbols (*, †, ‡, §) indicating significance (at 0.05 level). He-ADMSC = healthy ADMSC (i.e. cultivated in normal medium); Sd-ADMSC = serum-deprived ADMSC. (n = 6 in each group).