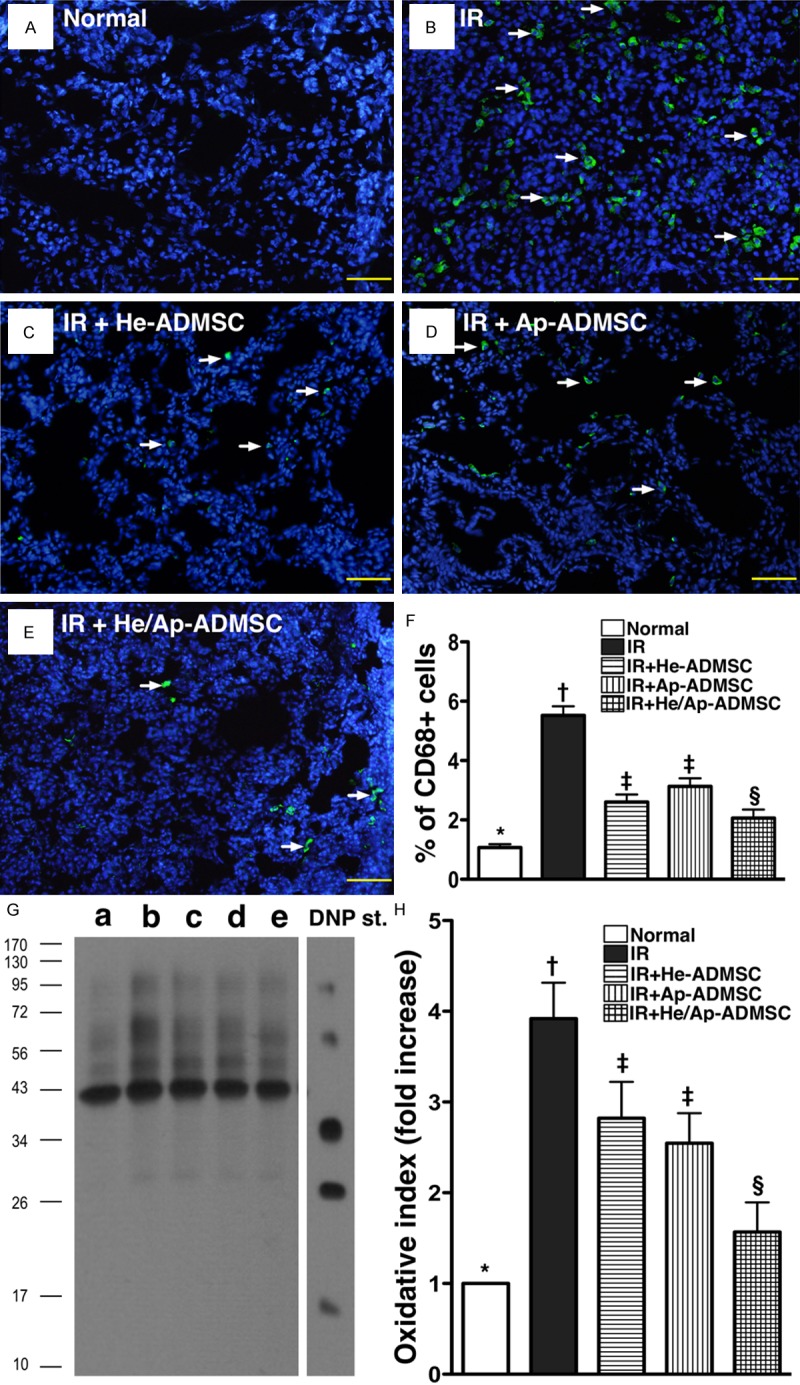
Figure 10.

Immunofluorescent staining for CD 68+ cells and Western blotting for oxidized protein expression in left lung parenchyma at 72 h after ischemia-reperfusion (IR). A-E. IF staining showing infiltration of left lung parenchyma with CD68+ cells (white arrows). F. Prevalence of CD68+ cells in left lung among the five animal groups at post-IR 72 h. *vs. other bars with different symbols, p < 0.001. G. Expression of protein carbonyls (i.e., oxidized protein), an oxidative index, in the five groups of animals (Note: Right lane and left lane shown on upper panel representing control oxidized molecular protein standard and protein molecular weight marker, respectively). DNP = 1-3 dinitrophenylhydrazone. H. Oxidative index in left lung tissue among five groups at post-IR 72 h. *vs. other bars with different symbols, p < 0.0001. Symbols (*, †, ‡, §) indicating significance (at 0.05 level). He-ADMSC = healthy ADMSC (i.e. cultivated in normal medium); Sd-ADMSC = serum-deprived ADMSC. (n = 6 in each group).
