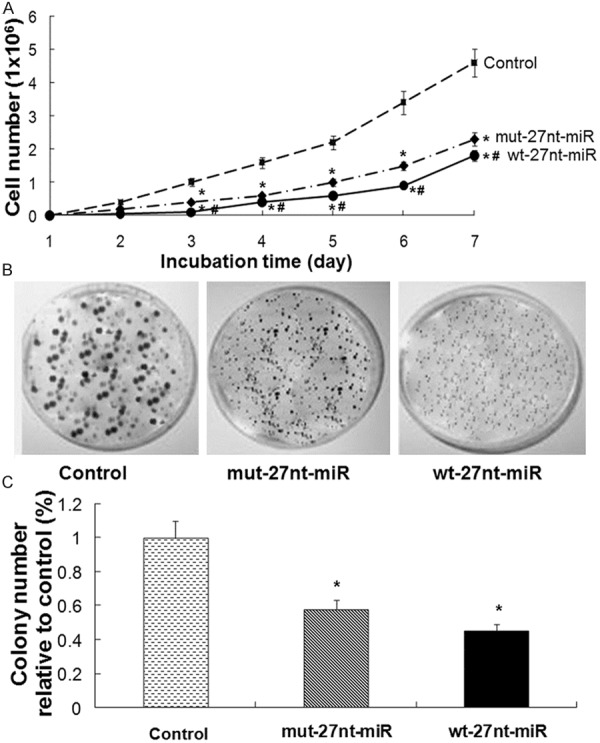
Figure 1.

Cell proliferation and colony formation analysis. A. Endothelial cells stably transfected with the control plasmid and the plasmids expressing the wt-27nt miR and mut-27nt miR were seeded at a concentration of 2 × 10³ cells/well in 96-well plates and then were counted at day 1 to day 7 of culture. Proliferation curve of cells was generated based on cell numbers. B and C. Endothelial cells stably transfected with the control plasmid and the plasmids expressing the wt-27nt miR and mut-27nt miR were seeded at a concentration of 1 × 10³ cells/well in 6 cm petri dish and incubated for 15 days for colony formation. Representative images and quantitative results were shown. Data were shown as means ± SD of three independent experiments. Compared with control group, *P < 0.01; Compared with mut-27nt miR group, #P < 0.01.
