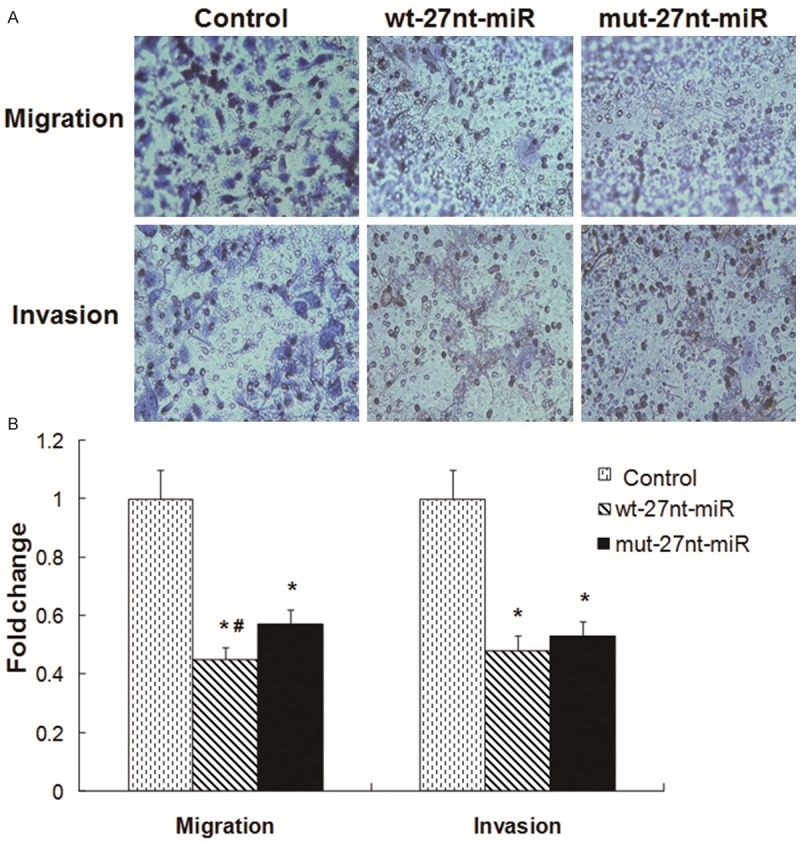
Figure 2.

Cell migration and invasion analysis. For transwell migration assay, cells were seeded at a concentration of 2 × 10⁵. For invasion assay, cells were seeded at a concentration of 5 × 10⁴. The cells were incubated for 24 to 36 h. A. Representative images were shown. Magnification: × 100. B. Quantitative results were shown. Data represented the fold change in migration/invasion as compared with the migration/invasion of control group. Compared with control, *P < 0.01. Compared with mut-27nt-miR, #P < 0.01.
