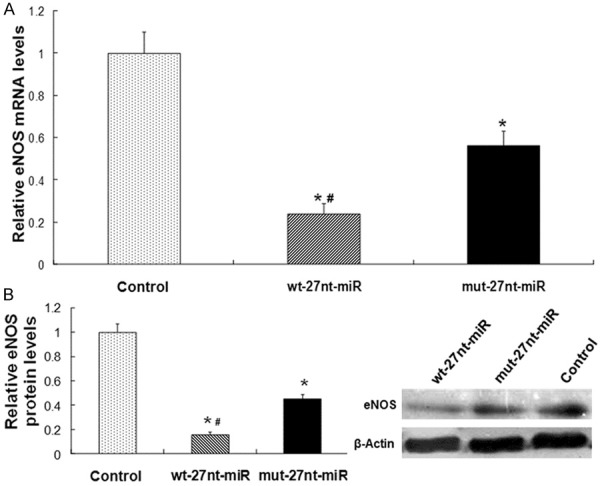
Figure 3.

Analysis of eNOS expression. The eNOS expression at mRNA and protein level was detected by real-time RT-PCR and Western blotting analysis, respectively. A. Quantitative real-time RT-PCR results. B. Quantitative (left panel) and representative (right panel) Western blotting results. Three independent experiments were performed. Data were expressed as means ± SD. Compared with control, *P < 0.01. Compared with mut-27nt-miR, #P < 0.01.
