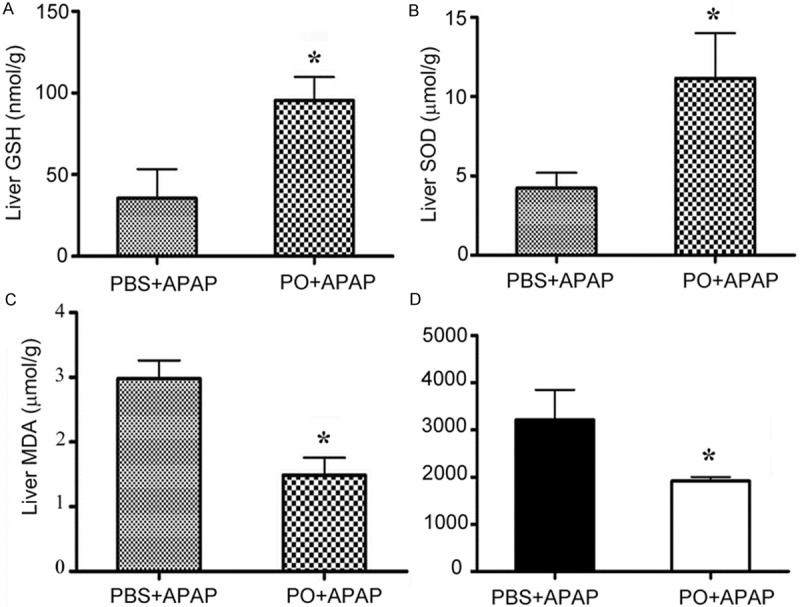
Figure 2.

Effects of PO on levels of the GSH, SOD, MDA, and ROS in livers of APAP-treated mice. PBS treated mice and PO pretreated mice were challenged with APAP for 6 h, and the hepatic GSH (A) and SOD (B) activities, the liver MDA (C) and ROS (D) levels were measured. Data were expressed as the means ± SD (n=5 *P < 0.05 versus PBS+APAP group).
