Figure 1.

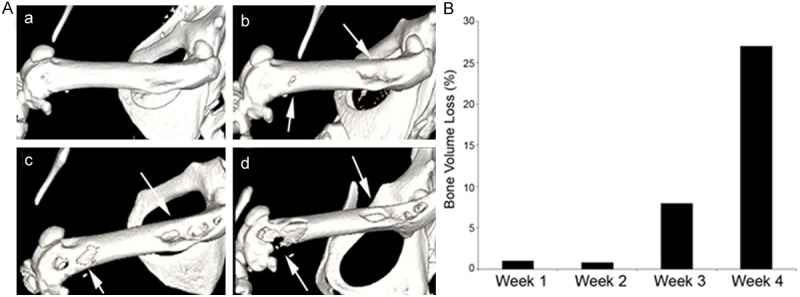
Micro CT analysis of progressive bone loss in a mouse femur directly injected with PC3-B1 prostate cancer cells. A. 3D micro CT analysis was performed at 1 week (a), 2 weeks (b) and 3 weeks (c) and 4 weeks (d) after direct tumor cell injection. Arrows demarcate tumor induced bone loss detected by 3D micro CT images. B. Quantification of total bone loss in the mouse femur was determined using 3D image analysis and IRW software (Siemens). Progressive femoral lesions in the same mouse demonstrated an 8% and 27% increase in bone volume loss by 3 and 4 weeks, respectively.
