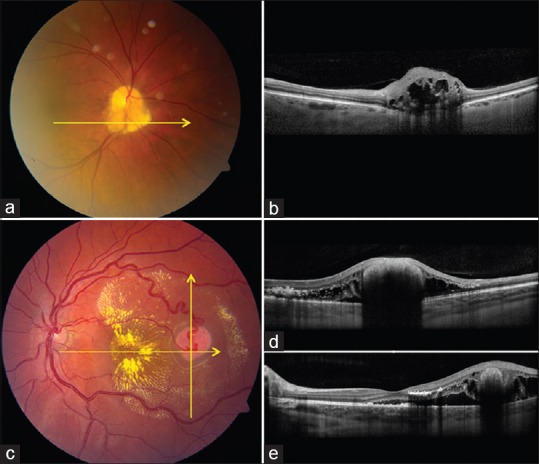
Figure 2.

Retinal astrocytic hamartoma and hemangioblastoma. (a and b) Retinal astrocytic hamartoma (a) with enhanced depth imaging optical coherence tomography (EDI-OCT) (b) showing the inner retinal mass compressing the outer retina and with central full-thickness involvement and “moth-eaten” lucencies. (c-e) Retinal hemangioblastoma (c) with EDI-OCT (d and e) showing exophytic mass pushing inner retina, outer retinal edema, subretinal debris and fluid
