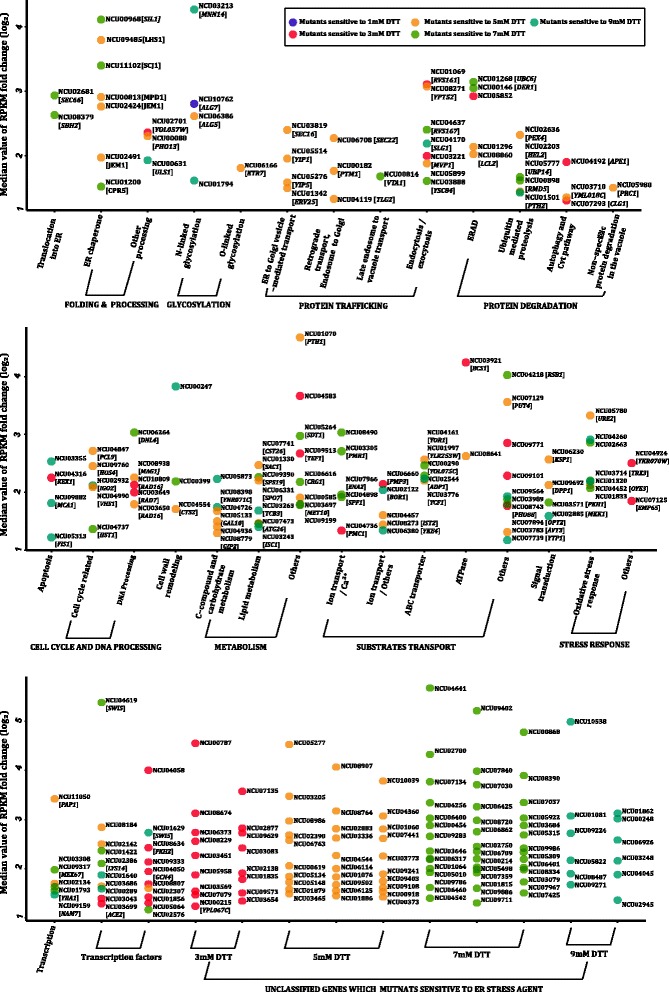
Figure 3.

Expression induction and functional categorization of 249 N. crassa KO mutants which exhibited ER stress susceptibility. Each point on the scatter plot represents the median value of fold changes of WT on mild DTT, mild TM, acute DTT, and acute TM (log2 normalized, the full data see Additional file 3: Table S3, p3) and functional category of an ESRT gene whose KO mutants exhibited ER stress susceptibility. DTT-sensitive phenotypes are plotted using different colors, from strongest to weakest along a gradient of dark-purple (sensitive to 1 mM DTT), red (3 mM), orange (5 mM), green (7 mM) to cyan (9 mM).
