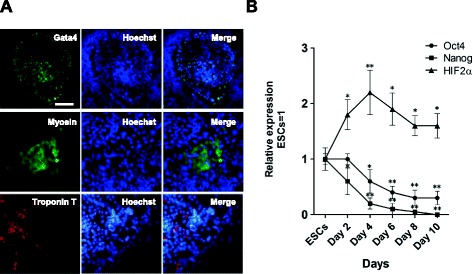
Figure 2.

Expression profile of HIF2α during cardiac differentiation. (A) Immunostaining for cardiomyocyte markers Gata4, Myosin and Troponin T in mouse ESC-derived EBs at day 10. Scale bar, 100 μm. (B) qRT-PCR analysis of Oct4, Nanog and HIF2α in mouse ESCs and different days of ESCs-derived EBs. Data represent the mean ± s.d. of three biological replicates. *p < 0.05, **p < 0.01 vs ESCs.
