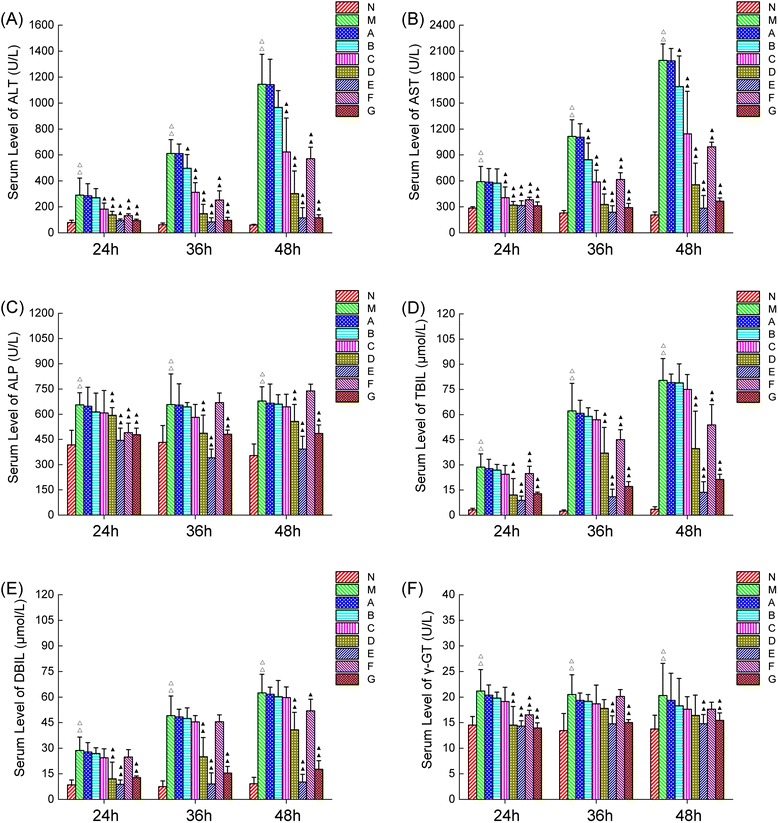
Figure 6.

Serum ALT, ALP, AST, TBIL, DBIL and γ-GT levels in 9 groups of rats treated with or without CDTHD. N: Normal, M: Model, A: 5.4 g/kg CDTHD, B: 10.8 g/kg CDTHD, C: 21.6 g/kg CDTHD, D: 43.2 g/kg CDTHD, E: 86.4 g/kg CDTHD, F: 35.1 g/kg CDTHD, G: 62.1 g/kg CDTHD. △ p < 0.05, △△ p < 0.01 compared with normal group. ▲ p < 0.05, ▲▲ p < 0.01 compared with model group.
