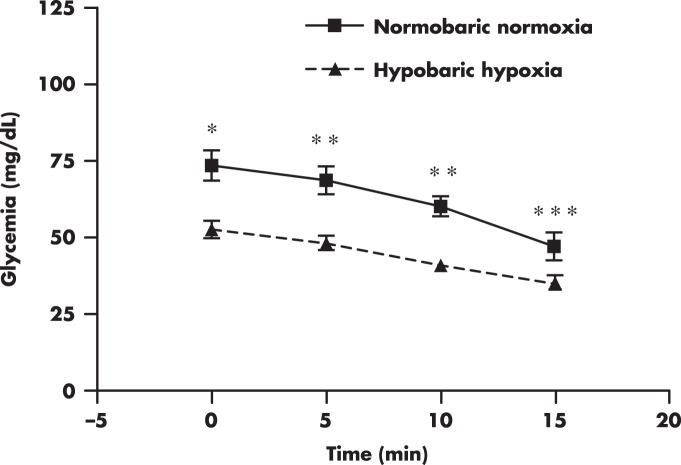
Figure 2. Glycemia profile during an iv insulin tolerance test performed at 150 m (normobaric normoxia) and after acute exposure to simulated altitude (hypobaric hypoxia) at 3200 m.
Male subjects (BMI, 26 ± 3.53 kg/m2 [mean ± SD]) were in an approximately 15-hour fasting state before the commencement of the test (O. Woolcott, unpublished data). *, P < .01; **, P < .001; ***, P < .05, hypobaric hypoxia vs normobaric normoxia.

