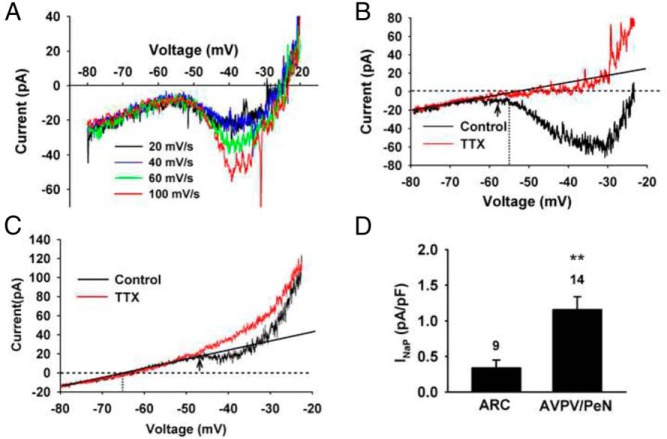
Figure 1.
INaP in AVPV/PeN and ARC Kiss1 neurons. A, Representative recordings showing the relationship between INaP and voltage ramps (speeds from 20 mV/sec to 100 mV/sec) from an AVPV/PeN Kiss1 neuron. B and C, Voltage clamp recordings showing INaP generated by a voltage ramp from −80 to −20 mV at 20 mV/sec before (black trace; control) and after (red trace) application of TTX (1 μM) in representative AVPV/PeN (B) and ARC (C) Kiss1 neurons. The black straight line indicates the linear part of the whole-cell current in the presence of TTX. The horizontal stippled line indicates the zero current level. The vertical stippled line marks the resting membrane potential, and the arrow points to activation threshold for the INaP. D, Comparison of INaP density measured at −45 mV in AVPV/PeN Kiss1 neurons and ARC Kiss1 neurons from high-E2 animals. **, P < .01, n = 9–14; Student's t test.

