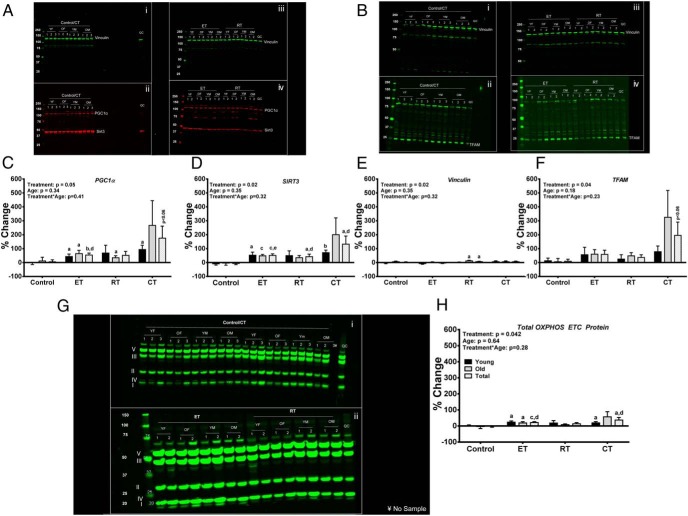
Figure 2.
Panels A and B present representative blots for PGC1α, SIRT3, Vinculin, and TFAM. Blots Ai and Aii are the same blot incubated in antibodies for Vinculin (Ai), PGC1α (Aii), and SIRT3 (Aii) for the control/combined (CT) group. Blots Aiii and Aiv are the same blot incubated in antibodies for Vinculin (Aiii), PGC1α (Aiv), and SIRT3 (Aiv) for the endurance training (ET) and resistance training (RT) groups. Blots Bi and Bii are the same blot incubated in antibodies for Vinculin (Bi) and TFAM (Bii) for the control/CT group. Blots Biii and Biv are the same blot incubated in antibodies for Vinculin (Biii) and TFAM (Biv) for the ET and RT groups. Panels C–F present the densitometry for PGC1α, SIRT3, Vinculin, and TFAM, respectively. The densitometry for Vinculin was performed on the PGC1α/SIRT3 blots (Panel A). Panel G presents representative blots for the Mitosciences Total OXPHOS Electron Transport Chain (ETC) protein abundance for the control/CT (Gi) and ET (Gii) and RT (Gii) groups.Panel H presents the integrated intensity of bands detected by the Mitosciences Total OXPHOS ETC protein antibody cocktail ranging from ∼10 kDa through ∼60 kDa was quantified and used to represent the abundance for the OXPHOS ETC proteins. One older ET participant's sample was excluded from the total OXPHOS ETC analysis due to a smear in the bands. Data are expressed as mean percentage change ± SEM. Total n = 60; n = 10 young, 10 old in each intervention group, 50/50 male/female. Data were analyzed as described in Figure 1. A, P < .05 (pre vs post); b, P < .01 (pre vs post); c, P < 0.001 (pre vs post); d, P < 0.05 (treatment vs control). YF, Young Female; OF, Old Female; YM, Young Male; and YO, Old Male.

